
More than ever the contribution of the Business Manager is crucial to navigating their school through the troubled financial times we are experiencing now and most likely into the foreseeable future. What the school needs is a financial crystal ball and I will explain why and how to build one.
Schools need information and advice in a simple format that will help guide their financial health during the adverse financial effects of the Covid-19 pandemic and the likely world-wide recession to follow.
Context
The Reserve Bank of Australia, together with bank economists are predicting a negative (5%) GDP this year and unemployment peaking at between 9% to 12% by mid-2020. Also of concern is a declining job participation rate meaning less people looking for work, mostly affecting the second household income and youth. It is often the second household income that pays school fees. Low interest rates (monetary policy) and significant government financial incentives (fiscal policy) are trying to hold off a recession. But a recession-like economy is probable for Australia and World-wide.
History may or may not be an Indicator of the future
Figure 1 indicates that during the 1990’s recession and the 2007 Global Financial Crisis (GFC) enrolment growth in Independent Schools reduced, but still grew. During the recession enrolment growth for Catholic schools reduced but increased for Government schools. During the GFC both Catholic and Government school enrolment growth increased.
Indications are that Independent schools are holding enrolments for now, but it is possible growth may flatten in the future.
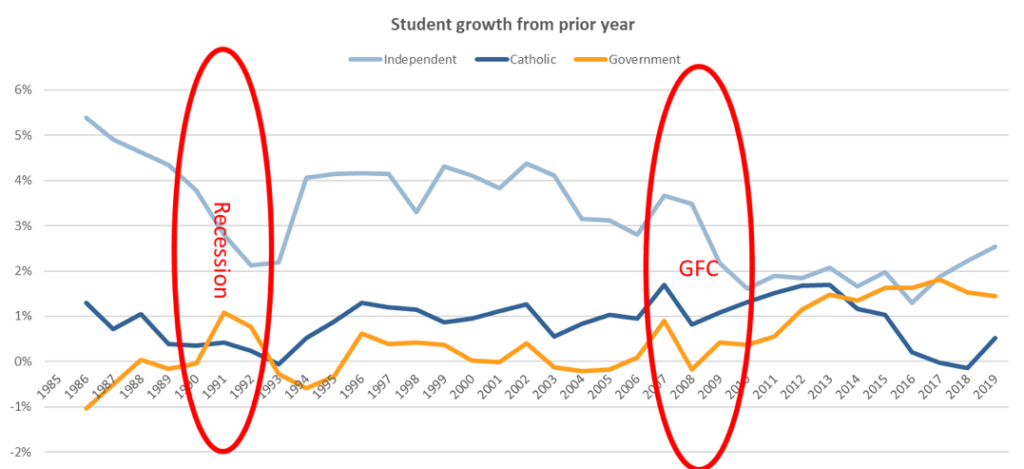
Figure 1 Source Independent Schools Council of Australia Student Growth
Somerset Education has conducted the ASBA/Somerset Non-Government Schools’ Financial Performance Survey (FPS) for over 25 years, but does not have data from the 1990 recession. Figure 2 indicates that during the GFC the average Net Operating Margin reduced slightly but remained at about 11%. The average 2018 Net Operating Margin of 12.6% means an operating surplus of $126,000 for every $1 million in gross recurrent income. This surplus is usually spent on facilities and debt servicing.
During the GFC, debtors (outstanding fees) increased as they are now during this Covid-19 pandemic period.
Schools have not had time to adjust for the rapid financial effects of the Covid-19 pandemic, in particular parents/caregiver’s inability to pay school fees due to loss of jobs and decreased job participation rates. We will not know the effect on operating surpluses until 2020 school-year data is analysed next year, however I would not be surprised if the average Net Operating Margin for 2020 reduces to between 9% to 11%.
Schools need to prepare now to prevent operating surpluses falling for 2021 and beyond.
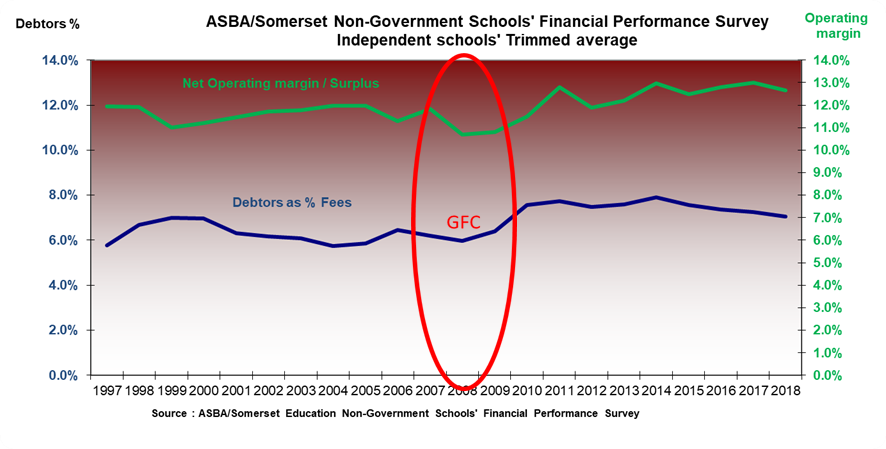
Figure 2 Net Operating Margin (relative operating surplus) and Debtors
How have schools responded so far
The recent NAB Education Pulse Check Survey and podcast indicates average school-wide fee concessions of 10% to 15% in term 2 2020 plus targeted reductions. 43% of schools implemented significant cost savings and 36% significantly reduced non-essential staff. Over half of the schools surveyed indicated a moderate to significant concern about pricing, profitability and cashflow and to a slightly lesser extent were concerned about student retention rates.
What to do now
To build a financial crystal ball schools should consider:
1. Regularly updating the forecast 2020 operating performance and cash flows considering government assistance, enrolments, concessions, outstanding fees, staffing, cost savings, capital expenditure and loan repayments
2. Present cashflows in a simple format, assisted with graphs, showing forecast cash at bank plus borrowing limits on monthly (or shorter) rests particularly at cash low points of June and December
3. Participate in the FPS to generate benchmarking reports comparing income, expenditure and staffing to similar schools to identify and quantify strengths and weaknesses
4. Use the Staff Estimator tool on the FPS portal to guide staffing numbers for enrolment scenarios
5. Consider demographics assisted by the Geo Mapping tools included on the FPS see video
6. Use the above information to inform strategic discussions
7. “Dollarise” strategy into a 12 month/10 year Income and Expenditure, Statement of Financial Position and Cash Flow budget including key ratios to compare with similar schools’ obtained from the FPS to assist integrity checks and risk assessment of the budget
8. Distil data into a simple format, like the Somerset Key Indicator Report (SKI Report) see video, also part of the FPS, that shows seven years (two years past, five years future) data and Key Performance Indicators (KPIs) on one page, facilitating trend and sample average analysis
9. Once settled on the financial plan, use a simple one-page board report to help monitor actual against budget and forecast during the year and respond to adverse variations in a timely manner.
Please see the following video that demonstrates how the FPS together with the Somerset Education School Budgeting and Reporting tools will help inform strategy and build a financial crystal ball.
Kindest regards

John Somerset is a Chartered Accountant. He has extensive knowledge of the independent school sector and is past President of Independent Schools Queensland and a past board member of the Independent Schools Council of Australia.
UPCOMING EVENTS:
AISWA Financial Governance in Crisis Times—Webinar, 9 June 2020.
IST Financial Governance in Crisis Times—Webinar, 16 June 2020.
VRQA School Financial Governance—Workshop, Melbourne 19 August 2020.
SEA School Financial Governance—Webinar, 26 August 2020.
ACS School Financial Governance—Webinar, 10 September 2020.